· 7 min read
Adrian Brudaru

The last 5 years before working on dlt, I spent as a data engineering freelancer. Before freelancing, I was working for "sexy but poor" startups where building fast and cheap was a religion.

In this time, I had the pleasure of doing many first time setups, and a few "rebuilds" or "second time setups".

In fact, my first freelancing project was a "disaster recovery" one.

A "second time build" or "disaster recovery project" refers to the process of re-designing, re-building, or significantly overhauling a data warehouse or data infrastructure after the initial setup has failed to meet the organization's needs.

dipping your toes in disaster

The first time builds gone wrong

There's usually no need for a second time build, if the first time build works. Rather, a migration might cut it. A second time build usually happens only if

  • the first time build does not work, either now or for the next requirements.
  • the first time build cannot be "migrated" or "fixed" due to fundamental flaws.

Let's take some examples from my experiences. Example 1: A serial talker takes a lead role at a large, growing startup. They speak like management, so management trusts. A few years later

  • half the pipelines are running on Pentaho + windows, the other are python 2, 3 and written by agencies.
  • The data engineering team quit. They had enough.
  • The remaining data engineers do what they want - a custom framework - or they threaten to quit, taking the only knowledge of the pipelines with them.
  • Solution: Re-write all pipelines in python3, replace custom framework with airflow, add tests, github, and other best pratices.

Example 2: A large international manufacturing company needed a data warehouse.

  • Microsoft sold them their tech+ consultants.
  • 2 years later, it's done but doesn't work (query time impossible)
  • Solution: Teach the home DE team to use redshift and migrate.

Example 3: A non technical professional takes a lead data role and uses a tool to do everything.

  • same as above but the person also hired a team of juniors
  • since there was no sudden ragequit, the situation persisted for a few years
  • after they left, the remaining team removed the tool and re-built.

Example 4: A first time data hire introduces a platform-like tool that's sql centric and has no versioning, api, or programmatic control.

  • after writing 30k+ lines of wet sql, scheduling and making them dependent on each other in this UI tool (without lineage), the person can no longer maintain the reports
  • Quits after arguing with management.
  • Solution: Reverse engineer existing reports, account for bugs and unfulfilled requirements, build them from scratch, occasionally searching the mass of sql. Outcome was under 2k lines.

Example 5: A VC company wants to make a tool that reads metrics from business apps like google ads, Stripe.

  • They end up at the largest local agency, who recommends them a single - tenant SaaS MDS for 90k to set up and a pathway from there
  • They agreed and then asked me to review. The agency person was aggressive and queried my knowledge on unrelated things, in an attempt to dismiss my assessment.
  • Turns out the agency was selling "installing 5tran and cleaning the data" for 5k+ per source, and some implementation partners time.
  • The VC later hired a non technical freelancer to do the work.

Who can build a first time setup that scales into the future?

The non-negotiable skills needed are

  • Programming. You can use ETL tools for ingestion, but they rarely solve the problem fully (under 20% in my respondent network - these are generally <30 people companies)
  • Modelling. Architecture first, sql second, tools third.
  • Requirement collection. You should consult your stakeholders on the data available to represent their process, and reach a good result. Usually the stakeholders are not experts and will not be able to give good requirements.

Who's to blame and what can we do about it?

I believe the blame is quite shared. The common denominators seem to be

  • A lack of technical knowledge,
  • tools to fill the gap.
  • and a warped or dishonest self representation (by vendor or professional)

As for what to do about it: If you were a hiring manager, ensure that your first data hire has all the skills at their disposal, and make sure they don't just talk the talk but walk the walk. Ask for references or test them.

But you aren't a hiring manager (those folks don't read this blog).

So here's what you can do

  • Ensure all 3 skills are available - they do not need to all be in one person. You could hire a freelance DE to build first, and a technical analyst to fulfil requests and extend the stack.
  • Let vendors write about first data hire, and "follow the money" - Check if the advice aligns with their financial incentive. If it does, get a second opinion.
  • Choose tooling that scales across different stages of a data stack lifecycle, so the problem doesn't occur.
  • Use vendor agnostic components where possible (for example, dlt + sqlmesh + sql glot can create a db-agnostic stack that enables you to switch between dbs)
  • Behave better - the temptation to oversell yourself is there, but you could check yourself and look for a position where you can learn. Your professional network could be your biggest help in your career, don't screw them over.
  • Use independent freelancers for consulting. They live off reputation, so look for the recommended ones.

How to do a disaster recovery?

The problem usually originates from the lack of a skill, which downstreams into implementations that don't scale. However, the solution is often not as simple as adding the skill, because various workarounds were created to bridge that gap, and those workarounds have people working on them.

Simply adding that missing skill to the team to build the missing piece would create a redundancy, which in its resolution would kick out the existing workarounds. But workarounds are maintained by roles, so the original implementer will usually feel their position threatened; This can easily escalate to a people conflict which often leads with the workaround maker quitting (or getting fired).

How to manage the emotions?

  • Be considerate of people's feelings - you are brought in to replace their work, so make it a cooperative experience where they can be the hero.
  • Ask for help when you are not sure about who has the decision over an area.

How to manage the technical side?

  • Ensure you have all the skills needed to deliver a data stack on the team.
  • If the existing solution produces correct results, use it as requirements for the next - for example, you could write tests that check that business rules are correctly implemented.
  • Clarify with stakeholders how much the old solution should be maintained - it will likely free up people to work on the new one.
  • Identify team skills that can help towards the new solution and consider them when choosing the technology stack.

What I wish I knew

Each "disaster recovery" project was more than just a technical reboot; it was a test to the team's adaptability and to their the humility to recognize and rectify mistakes. What I wish I knew is that building a data infrastructure is as much about building a culture of continuous learning and improvement as it is about the code and systems themselves, and that they need to be fixed together - otherwise, one will break the other.

Want to discuss?

Agencies and freelancers are often the heavy-lifters that are brought in to do such setups. Is this something you are currently doing? Tell us about your challenges, so we may better support you.

Join our slack community to take part in the conversation.

· 12 min read
Adrian Brudaru

shift-left-data-democracy

Definitions of how I use the terms:

Data Governance: A system of oversight and guidance over the data, much like a government is a system of oversight and guidance for a country. The opposite of governance is anarchy, chaos, and entropy.

Data Democracy: A type of governance that ensures stakeholders are part of the governance.

Shift left: Assuming data flows from left to right, shift left represents a focus towards the origin.

Data Mesh: A decentralized data management strategy that treats data as a product, with domain-specific teams managing its quality, governance, and lifecycle.

Shift Left Data Democracy: From Access to Involvement

In the traditional view, data democracy was largely about democratizing access—ensuring that everyone across the organization could easily retrieve and analyze data. This was a crucial step forward, breaking down silos and making information more available than ever before. However, as we've evolved, so too has our understanding of what true data democracy entails.

Shift left data democracy represents a more profound change. It's not just about making data accessible post-factum; it's about involving a broader spectrum of roles in the very processes of data ingestion, processing, and management. This approach extends the principles of democracy to the entire data lifecycle, beginning with data ingestion.

It's a shift from mere consumption to participation, where access is just the beginning.

Data mesh is the driver

Just as the data mesh concept emerged to address the complexities of managing data in a distributed, domain-oriented environment, we now see a need for technology to evolve in parallel. The goal? To put data sources directly in the hands of the people who use them. This means giving teams the tools and autonomy to manage and process their data, ensuring governance and quality from the outset and throughout the data's lifecycle.

This shift left approach to data democracy aligns with the idea behind data mesh, recognizing that effective data management and governance are not centralized activities but distributed responsibilities. By involving more stakeholders from the very start of the data flows, we're not just democratizing access; we're democratizing the entire data flows.

Governance, from a power game, to a team sport; A brief history of how we got here

Building a data warehouse is a beaten path - but how to go from technical solution to organisation-wide application?

Building a data warehouse for reporting on some business processes is a good start, but in order to leverage that data we need a culture to do so and the skills to do it correctly.

While a centralised solution enables a skilled team to deliver results, these results are often inflexible without hands on help - so how can the organisation be expected to become data driven? The process of tracking a goal, creating hypotheses, starting an experiment and then tracking outcomes is much more complex than that of tracking a metric in a dashboard.

Cue, the move to democratic data access.

From Monarchy to Democracy: Data access for the people!

The move from a centralised system to a democratic system comes from the competitive use of data. In a centralised system where only management has access, data is used to keep track of goals. To enable people to use that data to do something about the goals, the user must have access and understanding of the data.

As with anything, the first step is obvious: Give people access - without it, there is no progress. However, once we do that, the reality rears its ugly head: Access is not enough!

Democratic access is great but as long as the data producers are not providing clean documented data , we don't have a democracy. Instead what we have is reality-adjusted communism - we all have plentiful access to the same black box or garbage that the big central team put in.

monarchy-to-democracy

So, after democratizing data access, the next challenge was to answer the obvious question: So what does this data mean?

Turns out, the central team doesn't quite know either - it's rather the owner of the process we track, the data producer, that understands how the data they emit links to the real life process it tracks.

So how do we go from having data to understanding what it means?

From democratizing access to democratizing literacy though embedded analysts

One easy way to help teams understand the data is to give them an analyst resource. And what better than someone who knows their domain?

Cue the embedded analysts. These folks are crucial in bridging the gap between data capabilities and domain-specific needs. By positioning data experts within specific business units, organizations can ensure that the insights generated are highly relevant and immediately applicable to the domain's unique challenges and opportunities.

democracy-to-embedded

This placement helps in several key ways:

  • Domain expertise meets data munging: Embedded analysts develop a deep understanding of the specific challenges and workflows of the business unit they are part of, which enables them to tailor data models and analytics strategies effectively.
  • Data literacy: These analysts act as champions of data within their teams, educating and training non-data savvy members on data-driven decision-making processes. This upskills the team and increases the overall data literacy within the unit.
  • Faster response times: Being close to the operational realities of the business unit, embedded analysts can deliver faster, more targeted responses to data queries and needs, reducing the time from question to insight.

And just as we started, we solve another increment of the problem, which reveals the next.

Now that we can analyse the data, we need the data. But, it turns out the data we have is dirty, and we are missing some outright.

So let's solve the next problem: Data sources and quality.

The Advent of Data Mesh: Solving the data source problem

Wow, well we went quite a way to get here, and a decade after talking about democratization, we are starting to recognize that governance is an activity, not a process. And democracy is more work than we originally thought.

embedded-to-mesh

The data mesh architecture marks a significant evolution in the data democratization journey. Data mesh advances the principles of embedded analysts by decentralizing data ownership entirely, promoting domain-specific control over data assets.

This architectural approach is based on the idea that data should not only be accessible but also actionable across various sections of an organization without bottlenecks.

And just like governments hire a lot of people, turns out, a governance system also needs people to work for it.

Data mesh tries to solve much of that by embracing domain-oriented decentralization. In this model, data is treated as a product with the domain teams as the product owners. These teams are responsible for ensuring their data's quality and relevance, significantly reducing the latency issues found in centralized systems by eliminating the lengthy processes of data cleansing and approval.

Further, data mesh empowers teams with the necessary tools and authority to manage their data effectively, fostering a culture where data is a valuable asset across all levels of the organization. This approach not only supports rapid decision-making and innovation within teams but also offers scalability and flexibility as organizational data needs evolve, allowing domains to independently expand their data operations without a comprehensive overhaul of the central data infrastructure.

Of course, at this point having a complete or partial data platform that offers some governance starts to become very important as we don't want individual business units to be burdened with responsibity but without proper tooling - or the outcome will be high entropy.

From retrofitting governance to applying it from the start: Shift left data democracy!

mesh-to-sldd

Imagine a world where your company's data sources can just be picked and unpacked in the destination of your choice by analysts - not through an external saas tool, but via an internal service portal.

Shift-Left Data Democracy (SLDD) is a concept in data management that advocates for integrating data governance early in the data lifecycle. This approach shifts governance practices from being a retrospective or reactionary activity to an integral part of the initial design and development phases of data systems. By doing so, SLDD aims to embed governance, quality controls, and compliance measures at the point of data creation and throughout its subsequent handling.

By embedding governance early in the data lifecycle, SLDD eliminates the complex and costly process of retrofitting governance frameworks to mature datasets and systems. This proactive approach leads to streamlined operations, reducing both the complexity and the cost traditionally associated with late-stage governance implementation.

This early incorporation of governance enhances transparency throughout the entire process. Stakeholders gain a clear understanding of how data is managed and governed from the start, building trust and ensuring compliance.

What's revolutionary about SLDD is that a governed data source can easily be unfolded into a normalised or analytical model.

This "ad hoc data mart" can be used without central bottlenecks and easily customised to fit specific cases without having to reach modelling consensus with other teams. This built-in modularity avoids the creation of more bottlenecks downstream, enabling fast research and development where needed.

Further, a well-defined governance framework enables greater innovation within safe boundaries. Teams can explore and innovate knowing they are aligned with compliance and operational standards, which speeds up experimentation and development cycles. This environment encourages a more dynamic approach to data handling, where creativity is not stifled by fear of violating governance protocols. By treating governance as an integral part of the data management process rather than a hindrance, SLDD fosters a culture where data truly drives innovation.

Distinction between data mesh and shift-left data democracy

While both concepts advocate for decentralized governance, they focus on different aspects of the data lifecycle. Data mesh architecture emphasizes the structural and operational decentralization of data management, granting autonomy to domain-specific teams. Shift-left data democracy, on the other hand, extends this decentralization to the very beginning of the data lifecycle, advocating for early involvement and broad stakeholder participation in governance processes.

The main difference is: Mesh is applied post-factum. For newly built systems, starting with governance as a technical universal standard is less complex. And while mesh grants autonomy, the entropy raises complexities and cost; on the other hand formalising and standardising responsibilities from the start of data production reduces entropy.

Practicing shift-left data democracy

So how do we do it? Is this a future or can we already do it?

We asked ourselves the same and we are working towards fully supporting the standard.

Ensuring quality at the source

Start with having quality control embedded in the source. Here's what I mean - start with a clear schema for your data, and ensure you have a strategy to adapt to change. One such strategy could be having data contracts, refusing and data that does not fit the defined schema. The other strategy, would be evolving the schema into a staging layer and notifying changes, so the engineering analyst can look into the data to understand what happened and correctly deal with the change.

At dlt we support schema evolution and data contracts. docs.

Metadata for full lineage

Column and row level lineage are a basic necessity of development and traceability, so ensure each ingested package is annotated with source and time. Keep track of when columns are added to a source. Associate those schema changes with the corresponding load package to achieve column and row level lineage already from the ingestion layer, referring to a source defined as pipeline code, not table.

Besides data lineage, you want semantic metadata. What does a source actually represent as a business entity or process? To govern data semantically, we would need semantic tags at the source. This would enable us to know how to work with the data. For example, we could generate data vault, 3nf, star schema or activity schema models algorithmically starting from annotated json documents.

Besides business entities, domains or processes, semantic tags could also designate PII, security policies, or anything actionable. For example, PII tags could enable automatic lineage documentation and governance, while access tags could enable automatic access policies or automatic data modelling.

dlt currently supports column and row level lineage, as well as schema comments - which could be used as annotations.

The role of the Data platform engineer will grow

In a shift left data democracy, the data platform engineer is a key character, as much as a CTO is in an organisation. By having a data platform engineer you ensure your data governance is done with automated tooling, to support implementation and compliance.

These data platform engineer becomes pivotal in empowering the democratization of data, providing the essential tooling and infrastructure that allow teams across the organization to manage their data autonomously.

Data platform engineers become enablers and facilitators, embedding governance and quality controls right from the start of the data lifecycle. Their work supports the organization by ensuring that data management practices are not only compliant and secure but also accessible and intuitive for non-specialists (democratic). This shift underlines a transition from centralized control to distributed empowerment, where data platform engineers support the broader goal of making data accessible, manageable, and governable across the entire spectrum of the organization.

The future of data management

history_to_future

Are we heading towards semantically annotated data marts as code? Why not? We're in the age of serverless infrastructures, after all. Could data sociocracy become the future? Would we eventually encourage the entire organisation to annotate data sources with their learnings? Only time will tell.

Want to discuss?

Join the dlt slack community to take part in the conversation.

· 8 min read
Adrian Brudaru

The concept of simplicity and automation in a programming language is not new. Perl scripting language had the motto "Perl makes easy things easy and hard things possible".

The reason for this motto, was the difficulty of working with C, which requires more manual handling of resources and also a compilation step.

Perl scripts could be written and executed rapidly, making it ideal for tasks that needed quick development cycles. This ease of use and ability to handle complex tasks without cumbersome syntax made Perl incredibly popular in its heyday.

Perl was introduced as a scripting language that emphasized getting things done. It was created as a practical extraction and reporting tool, which quickly found its place in system administration, web development, and network programming.

History repeats, Python is a language for humans

human-building

Python took the philosophy of making programming more accessible and human-friendly even further. Guido van Rossum created Python with the goal of removing the drudgery from coding, choosing to prioritize readability and simplicity. This design philosophy makes Python an intuitive language not just for seasoned developers but for beginners as well. Its syntax is clean and expressive, allowing developers to write fewer lines of code for tasks that would require more in Perl or other languages. Python's extensive standard library, along with its powerful data structures, contribute to its ability to handle complex applications with ease.

Python's widespread adoption across various domains, from web development to data science and machine learning, is largely attributed to its accessibility.

Its simple syntax resembles natural language, which lowers the barrier to entry for programming. Compared to Perl, Python offers an even more organized and readable approach to coding, making it an ideal teaching language that prepares new developers for future challenges in software development.

And just like perl, it's used for data extraction and visualisation - but now it's done by normie humans, not sysadmins or devs.

dlt makes easy things fast, and hard things accessible

Following the principles of Perl and Python, dlt aimed to simplify the data engineering process. dlt focuses on making the extraction and loading of data as straightforward as possible.

dlt makes easy things fast

Starting from a simple abstraction like pipeline.run(data, table_name="table"), where data can be any iterable such as a generator or dataframe, dlt enables robust loading. Here is what the above function does, so you don't have to.

  • It will (optionally) unpack nested lists into separate tables with generated join keys, and flatten nested dictionaries into a main row.
  • If given a generator, it will consume it via microbatching, buffering to disk or external drives, never running out of memory (customisable).
  • it will create "extract packages" of extracted data so if the downstream steps fail, it can resume/retry later.
  • It will normalise the data into a shape that naturally fits the database (customisable).
  • It will create "load packages" of normalised data so if the downstream steps fail, it can retry later.
  • It infers and loads with the correct data types, for example from ISO timestamp strings (configurable).
  • It can accept different types of write dispositions declaratively such as 'append', 'merge' and 'replace'.
  • It will evolve the schema if we load a second time something with new columns, and it can alert the schema changes.
  • It will even create type variant columns if data types change (and alert if desired).
  • Or you can stop the schema from evolving and use the inferred schema or a modified one as a data contract
  • It will report load packages associated with new columns, enabling passing down column level lineage

That's a lot of development and maintenance pain solved only at its simplest. You could say, the dlt loader doesn't break, as long as it encounters common data types. If an obscure type is in your data, it would need to be added to dlt or converted beforehand.

From robust loading to robust extraction

Building on the simple loading abstraction, dlt is more than a tool for simple things.

The next step in dlt usage is to leverage it for extraction. dlt offers the concepts of 'source' and 'resource', A resource is the equivalent of a single data source, while a source is the group we put resources in to bundle them for usage.

For example, an API extractor from a single API with multiple endpoints, would be built as a source with multiple resources.

Resources enable you to easily configure how the data in that resource is loaded. You can create a resource by decorating a method with the '@resource' decorator, or you can generate them dynamically.

Examples of dynamic resources

  • If we have an api with multiple endpoints, we can put the endpoints in a list and iterate over it to generate resources
  • If we have an endpoint that gives us datapoints with different schemas, we could split them by a column in the data.
  • Similarly, if we have a webhook that listens to multiple types of events, it can dispatch each event type to its own table based on the data.
  • Or, if we want to shard a data stream into day-shards, we could append a date suffix in the resource name dynamically.

Once we group resources into a source, we can run them together (or, we could still run the resources independently)

Examples of reasons to group resources into sources.

  • We want to run (load) them together on the same schedule
  • We want to configure them together or keep their schemas together
  • They represent a single API and we want to publish them in a coherent, easy to use way.

So what are the efforts you spare when using dlt here?

  • A source can function similar to a class, but simpler, encouraging code reuse and simplicity.
  • Resources offer more granular configuration options
  • Resources can also be transformers, passing data between them in a microbatched way enabling patters like enrichments or list/detail endpoints.
  • Source schemas can be configured with various options such as pushing down top level columns into nested structures
  • dlt's requests replacement has built in retries for non-permanent error codes. This safeguards the progress of long extraction jobs that could otherwise break over and over (if retried as a whole) due to network or source api issues.

What else does dlt bring to the table?

Beyond the ease of data extraction and loading, dlt introduces several advanced features that further simplify data engineering tasks:

Asynchronous operations: dlt harnesses the power of asynchronous programming to manage I/O-bound and network operations efficiently. This means faster data processing, better resource utilization, and more responsive applications, especially when dealing with high volumes of data or remote data sources.

Flexible destinations and reverse ETL: dlt isn't just about pulling data in; it's about sending it where it needs to go. Whether it's a SQL database, a data lake, or a cloud-based storage solution or a custom reverse etl destination, dlt provides the flexibility to integrate with various destinations.

Optional T in ETL: With dlt, transformations are not an afterthought but a core feature. You can define transformations as part of your data pipelines, ensuring that the data is not just moved but refined, enriched, and shaped to fit your analytical needs. This capability allows for more sophisticated data modeling and preparation tasks to be streamlined within your ELT processes.

Data quality and observability: dlt places a strong emphasis on data quality and observability. It includes features for schema evolution tracking, data type validation, and error handling, and data contracts, which are critical for maintaining the integrity of your data ecosystem. Observability tools integrated within dlt help monitor the health and performance of your pipelines, providing insights into data flows, bottlenecks, and potential issues before they escalate.

Community and ecosystem: One of the most significant advantages of dlt is its growing community and ecosystem. Similar to Python, dlt benefits from contributions that extend its capabilities, including connectors, plugins, and integrations. This collaborative environment ensures that dlt remains at the forefront of data engineering innovation, adapting to new challenges and opportunities.

In essence, dlt is not just a tool but a comprehensive one stop shop that addresses the end-to-end needs of modern data ingestion. By combining the simplicity of Python with the robustness of enterprise-grade tools, dlt democratizes data engineering, making it accessible to a broader audience. Whether you're a data scientist, analyst, or engineer, dlt empowers you to focus on what matters most: deriving insights and value from your data.

Conclusion

As Perl and Python have made programming more accessible, dlt is set to transform data engineering by making sophisticated data operations accessible to all. This marks a significant shift towards the democratization of technology, enabling more individuals to contribute to and benefit from the digital landscape. dlt isn't just about making easy things fast and hard things accessible; it's about preparing a future where data engineering becomes an integral part of every data professional's toolkit.

· 8 min read
Adrian Brudaru

Why Python is the right approach for doing Reverse ETL

Reverse ETL is generally about putting data into a business application. This data would often come from a SQL database used as a middle layer for data integrations and calculations.

That’s fine - but nowadays most data people speak Python, and the types of things we want to put into an operational application don’t always come from a DB, they often come from other business applications, or from things like a dataframe on which we did some scoring, etc.

reverse etl

The full potential of Reverse ETL is in the flexibility of sources

SQL databases are a good start, but in reality very often our data source is something else. More often than not, it’s a Python analyst’s implementation of some scoring or some business calculation.

Other times, it’s a business application - for example, we might have a form that sends the response data to a webhook, from where it could end up in Salesforce, DWH, and Slack as a notification. And of course, if this is done by a data person it will be done in Python.

Such, it follows that if we want to cater to the data crowd, we need to be Pythonic.

There’s synergy with ETL

Reverse ETL is ultimately ETL. Data is extracted from a source, its transformed, and then loaded to a destination. The challenges are similar, the most notable difference being that pulling data from a strongly typed environment like a DB and converting it to weakly typed JSON is MUCH easier than the other way around. You can argue that Reverse ETL is simpler than ETL.

Flavors of Reverse ETL

Just like we have ETL and ELT, we also have flavors of Reverse ETL

  • Reverse ETL or TEL: Transform the data to a specification, read it from DB, and send it to an application.
  • Tool Reverse ETL or ETL: Extract from DB, map fields to destination in the tool, load to destination.
  • Pythonic Freestyle Reverse ETL: You extract data from wherever you want and put it anywhere except storage/DB. Transformations are optional.

Examples of Python reverse ETL

  • Read data from Mongo, do anomaly detection, and notify anomalies to Slack.
  • Read membership data from Stripe, calculate the chance to churn, and upload to CRM for account managers.
  • Capture a form response with a webhook and send the information to CRM, DWH, and Slack.

Add python? - new skills unlocked!

So why is it much better to do reverse ETL in Python?

  • Live Streaming and Flexibility: Python's ability to handle live data streams and integrate with various APIs and services surpasses the capabilities of SQL-based data warehouses designed for batch processing.
  • End-to-End Workflow: Employing Python from data extraction to operational integration facilitates a streamlined workflow, enabling data teams to maintain consistency and efficiency across the pipeline.
  • Customization and Scalability: Python's versatility allows for tailored solutions that can scale with minimal overhead, reducing the reliance on additional tools and simplifying maintenance.
  • Collaboration and Governance: By keeping the entire data workflow within Python, teams can ensure better governance, compliance, and collaboration, leveraging common tools and repositories.

Example: Building a Custom Destination and a pipeline in under 1h

Documentation used: Building a destination: docs SQL source: docs In this example, you will see why it’s faster to build a custom destination than set up a separate tool.

dlt allows you to define custom destination functions. You'll write a function that extracts the relevant data from your dataframe and formats it for the Notion API.

This example assumes you have set up Google Sheets API access and obtained the necessary credentials to authenticate.

Step 1: Setting Up Google Sheets API (10min)

  1. Enable the Google Sheets API in the Google Developers Console.
  2. Download the credentials JSON file.
  3. Share the target Google Sheet with the email address found in your credentials JSON file.

Step 2: Define the Destination method in its own file sheets_destination.py (20min)

Install the required package for the Google API client:

pip install --upgrade google-api-python-client google-auth-httplib2 google-auth-oauthlib

Here’s how to define a destination function to update a Google Sheet. In our case we wrote a slightly complex function that checks the headers and aligns the columns with the existing ones before inserting:

import dlt
from google.oauth2.service_account import Credentials
from googleapiclient.discovery import build


@dlt.destination(batch_size=100)
def google_sheets(items,
table_schema,
sheets_id: str = dlt.config.value,
credentials_json: dict = dlt.secrets.value,
range_name: str = 'Sheet1'):
"""
Send data to a Google Sheet.
:param items: Batch of items to send.
:param table_schema: Schema of the table (unused in this example but required by dlt).
:param sheets_id: ID of the Google Sheet, retrieved from config.
:param credentials_json: Google Service Account credentials, retrieved from secrets.
:param range_name: The specific range within the Sheet where data should be appended.
"""
credentials = Credentials.from_service_account_info(credentials_json)
service = build('sheets', 'v4', credentials=credentials)

# Fetch existing headers from the sheet
existing_headers_result = service.spreadsheets().values().get(
spreadsheetId=sheets_id, range="Sheet1!A1:1"
).execute()
existing_headers = existing_headers_result.get('values', [[]])[0] if existing_headers_result.get('values') else []

# Determine new headers from items
new_keys = set().union(*(d.keys() for d in items))
# Identify headers that need to be added (not already existing)
headers_to_add = [key for key in new_keys if key not in existing_headers]
# New comprehensive headers list, preserving the order of existing headers and adding new ones at the end
comprehensive_headers = existing_headers + headers_to_add

# If there are headers to add, update the first row with comprehensive headers
if headers_to_add:
update_body = {'values': [comprehensive_headers]}
service.spreadsheets().values().update(
spreadsheetId=sheets_id, range="Sheet1!A1",
valueInputOption='RAW', body=update_body
).execute()

# Prepare the data rows according to the comprehensive headers list
values = []
for item in items:
row = [item.get(header, "") for header in comprehensive_headers] # Fill missing keys with empty string
values.append(row)

body = {'values': values}

# Append the data rows
if values:
append_body = {'values': values}
append_result = service.spreadsheets().values().append(
spreadsheetId=sheets_id, range=range_name,
valueInputOption='RAW', insertDataOption='INSERT_ROWS', body=append_body
).execute()
print(f"{append_result.get('updates').get('updatedRows')} rows have been added to the sheet.")


Step 3: Configure secrets (5min)

For the custom destination, you can follow this example. Configure the source as instructed in the source documentation.

secrets.toml

[destination.google_sheets]
credentials_json = '''
{
"type": "service_account",
"project_id": "your_project_id",
"private_key_id": "your_private_key_id",
...
}
'''

config.toml

sheets_id = "1xj6APSKhepp8-sJIucbD9DDx7eyBt4UI2KlAYaQ9EKs"

Step 4: Running the pipeline in sheets_destination.py(10min)

Now, assuming you have a source function dict_row_generator(), you can set up and run your pipeline as follows:

# ... destination code from above

# pass some destination arguments explicitly (`range_name`)
pipeline = dlt.pipeline("my_google_sheets_pipeline", destination=google_sheets(range_name="named_range"))

# Use the source function and specify the resource "people_report"
def dict_row_generator():
yield {"row": 1, 'a': "a"}
yield {"row": 2, 'b': "b"}
yield {"row": 3, 'c': "c"}
yield {"row": 1, 'a': 1}
yield {"row": 2, 'b': 2}
yield {"row": 3, 'c': 3}


# Now, run the pipeline with the specified source
info = pipeline.run(dict_row_generator)

In this setup, append_to_google_sheets acts as a custom destination within your dlt pipeline, pushing the fetched data to the specified Google Sheet. This method enables streamlined and secure data operations, fully utilizing Python's capabilities for Reverse ETL processes into Google Sheets.

What does dlt do for me here?

Using dlt for reverse ETL instead of plain Python, especially with its @dlt.destination decorator, provides a structured framework that streamlines the process of data integrating into various destinations. Here’s how the dlt decorator specifically aids you compared to crafting everything from scratch in plain Python:

Faster time to Production grade pipelines

The @dlt.destination decorator significantly reduces the need for custom boilerplate code. It provides a structured approach to manage batch processing, error handling, and retries, which would otherwise require complex custom implementations in plain Python. This built-in functionality ensures reliability and resilience in your data pipelines.

Focus on custom business logic and adding value

The flexibility of creating custom destinations with dlt shifts the focus from the possibilities to the necessities of your specific use case. This empowers you to concentrate on implementing the best solutions for your unique business requirements.

Scalability and efficient resource use

dlt facilitates efficient handling of large data loads through chunking and batching, allowing for optimal use of computing resources. This means even small worker machines can stream data effectively into your chosen endpoint instead of wasting a large machine waiting for the network. The library design supports easy scaling and adjustments. Making changes to batch sizes or configurations is straightforward, ensuring your data pipelines can grow and evolve with minimal effort. This approach simplifies maintenance and ensures that once a solution is implemented, it's broadly applicable across your projects.

In Conclusion

Reverse ETL is just a piece of the ETL puzzle. It could be done cleaner and better when done in Python end to end.

Tools will always appeal to the non-technical folks. However, anyone with the ability to do Python pipelines can do Reverse ETL pipelines too, bringing typical benefits of code vs tool to a dev team - customisation, collaboration, best practices, etc.

So read more about how to built a dlt destination and consider giving it a try in your next reverse ETL pipeline.

· 10 min read
Hiba Jamal

The advent of ChatGPT...

...sparked widespread speculation about the future of many professions, analytics included. Now, over a year later, and with an array of GPT and LLM-powered analytics tools at our disposal, we're in a stronger position to assess their intelligence and capabilities.

In this article, we explore ThoughtSpot, known for its simplicity and strong data democracy practices. However, our focus narrows to Sage, its LLM assistant, and examining how it can empower or replace analytics techniques carried out by different analysts.

Analysts: Fallen victims of AI or not?

The data analyst's role encompasses various job descriptions – from data science to dashboarding, data pipeline management, and even ML engineering. However, for this blog, we'll focus on the four key analytics components or techniques that help a company achieve its goals, as outlined by Gartner.

Gartner’s categories:

CategoriesWhat does it solve?TechniquesExample
DescriptiveAnswers the “What happened/is happening?” questionsData aggregation, pivot tables, mean, median, mode, variance, etc.What was our top selling product of 2023?
DiagnosticAnswers the “Why/How?” questionsDrill down, correlation, Regression/multivariate analysis (for understanding relationships), segmentation, etc.Why is this our top selling product (what are the common characteristics)? Or, What is the relationship between X and Y?
PrescriptiveAnswers the “Now what?”Setting rules/thresholds/goals based on the other 3 categories’ results.Based on past retention curves of different user segments, which segments should we chase more?
PredictiveForecasting and predicting outcomesProbability distributions, Regression analysis (for prediction), other ML, etc.What is our potential revenue for the next 2 years?

There have been solutions around utilizing LLMs to solve these analytics strategies, some of these attempts can be found on opensource sources and others as commercial products.

For example, Mariya Mansurova at Wise created a GPT driven LLM agent that can do descriptive analytics and other reporting tasks.

Other commercially existing solutions include:

  • ThoughtSpot’s Sage AI, an LLM analyst you can ask questions to about your data in simple language.
  • Pecan.ai, which creates predictive models based on cases described in simple language.
  • SnapLogic, which designs data workflows based on reporting needs through its generative integration capabilities.

ThoughtSpot’s Sage is powered by GPT - and as easy as GPT has made our lives, every GPT or any LLM user understands the importance of engineering a prompt good enough to actually get the answer one wants from the LLM. This might be a challenge open to AI driven analytics tools on how they cater to different types of users; for example, a business user can ask the same question differently than an analyst.

In this article, we've chosen ThoughtSpot's Sage as our emblem for AI-driven analytics. We'll assess its performance across various analytics scenarios, aligned with the four categories previously defined. Our discussion will explore whether AI, through Sage, serves to replace or enhance analysts these analytics domains. The style of questions we will ask Sage will be a mix of what can be posed in the language of a business user and an analyst.

The data & data model

The data that’ll be used for this experiment will be from the HubSpot CRM, regarding various deals, companies and contacts and different stages of their journey. This data was populated and then pulled via the HubSpot API in Python and then loaded into BigQuery via dlt. The data was structured into different tables by dlt and final model looks as follows:

data model

It is important to note how the child table, companies__deals show the association between the deals and companies tables. In other words, it shows which deal exists in the pipeline for which company. This model will be useful while trying to do some diagnostic analysis of different deals.

Evaluating Sage AI

Before diving in, it's important to note that ThoughtSpot can connect to dbt's semantic layer, which helps contextualize the questions asked - for example, by making clear what a certain success metric might mean. However, we haven't set up any semantic definitions or pre-built dashboards for this data. Our analysis will solely rely on raw data modeled by dlt. This approach might limit our ability to fully showcase ThoughtSpot's capabilities and the potential of combining AI in analytics with semantic modeling. Nonetheless, our focus here is on evaluating Sage AI's inference capabilities with raw data, across all categories except for prescriptive analytics, which leans more towards strategic business decision-making.

The lack of semantic definitions and other dashboards meant that for each question asked to Sage, we had to specify exactly which table it should look into, to find a result. For example:

example question

Let’s begin asking questions and see how Sage answers! The framing of each question is exactly as it was asked to Sage.

Descriptive Analytics

  1. How many companies do we have? ✅

  2. How many companies do we serve? ✅

  3. How many deals do we have by month? ✅

  4. Deals broken by industry, shown as percentages ❌

  5. Revenue of a deal by stage ❌ Proportion of each deal stage’s revenue ❌

  6. What percentage of companies is in the computer software industry? ✅

  7. Show revenue by month ✅ Worked even though the revenue column is named “amount” - it could infer!

  8. How many deals are signed by each company?

    This was by far the most astounding result! The underlying model is companies__deals, and it contains the unnested information for what deals belong to which company. The schema looks like this:

    schema

    a. Unnested means that there is a parent table, which here is companies, and a child table, which here is deals. A company can have several deals.

    b. The _dlt_parent_id then refers to a company id, saved in the companies table. This is a dlt assigned primary key to a company. Whereas, the value field is a HubSpot defined primary key to a company. Both saved as foreign keys in this table.

    c. The deals_id is also therefore present in the deals table.

    d. Whereas, _dlt_list_idx is another column to keep track of rows during the process of unnesting - courtesy of dlt. Perhaps given the naming convention of the table; companies__deals, and the word parent in the columns, Sage was able to infer the connection between the two. Here is the result:

    outcome

    To extend this result to include company names, I added joins in the ThoughtSpot data model as allowed by the tool, but it still did not seem to make a difference when it came to replacing the foreign keys with names of the companies. Nonetheless, the child table that dlt put into place still served its purpose for Sage to understand what it is, and that is a remarkable feat for both the tools!

  9. Best deals

    • Showed by revenue/amount in descending order.
  10. Least successful industry?

    • Showed by deals lost. Solving this question by using the status of deals (won/lost), rather than the revenue, as in the last prompt, shows the versatility of Sage and its understanding of data models.

Summary: Worked impressively well on the different types of questions asked, unless speaking on proportions.

Diagnostic Analytics

  1. What are the shared characteristics of top 5 deals? ❌ - it tried by showing all columns of 5 highest amounts.
  2. Drill through most successful deals ✅ - showed characteristics of most successful deals by revenue, and success of deal closing.
  3. What do the most successful deals have in common? ❌ - showed individual deal information as above.
  4. Cluster deals ❌ - showed all data.
  5. Segment deals ❌ - showed all data.
  6. Cluster deals by amount and industry ❌ - showed a useful graph between the two columns but no grouping.
  7. Relationship between amounts in closed-won and closed-lost ❌
  8. Regression with closed-won and closed-lost ❌

Summary: Does not work fairly well, will not work at all for business users. The area in ThoughtSpot where queries can be crafted with AI will answer most of these questions, but this tool would more so empower analysts than business users.

Predictive Analytics

  1. Probability of closing deals ❌ - showed by industry (however, it is a simple probability calculation, not a future prediction).
  2. Probability of closing deals in 2024/in the future/in the next 3 months ❌
  3. Predict/estimate/forecast revenue for 2024 ❌
  4. If we keep acquiring deals at the same rate as historical, how many will we have in 2024? ❌

Summary: Works well for probabilities but not predictions - but that was a bit of a stretch anyway, it would be something that would fall into the Forte of Pecan.ai. Sage instead relied on probability and aggregate values for existing data (filtered on future dates, like 2024).

Scores

The summary of our findings was quite predictable: Sage excelled at answering descriptive analytics questions more so than in diagnostic or predictive contexts. Its performance in interpreting descriptive queries was notably impressive.

The score:

  • Descriptive analytics: 6/8 (75%)
  • Diagnostic Analytics: 1/8 (12.5%)
  • Predictive Analytics: 0/4 (0%)

Conclusion

Regarding the debate on whether smart dashboarding or AI driven analytics tools could displace analysts, it appears that for basic descriptive tasks, especially when combined with semantic data definitions, analysts could potentially be replaced. This ties back to how much clarity in context is given to LLMs.

The importance of a solid data model was highlighted, proving essential for an LLM like Sage to accurately understand or deduce business user needs. However, when it comes to diagnostic tasks, AI in LLMs still has progress to make before they can fully replace analysts. Instead, they are more likely to empower analysts by offering solutions via interfaces like ChatGPT and handling descriptive tasks to save time.

In translating this to an analysts toolkit of capabilities, Sage worked well in instances where single simple SQL statements can be executed. This excludes the usage of calculations that can be made to work on window functions and other partition statements in SQL. Whereas, joins have to be specified in the data model if the data is to be pulled from multiple tables. From these SQL statements, Sage was able to construct good visualizations as well.

However, where the metrics or calculations surpassed the complexity of simple SQL statements to Python scripts, LLMs like ChatGPT can be used for script generation purposes. Since, as it stands today, GPT is better at writing code to calculate residuals or function coefficients than actually calculating these things itself.

· 5 min read
Matthaus Krzykowski

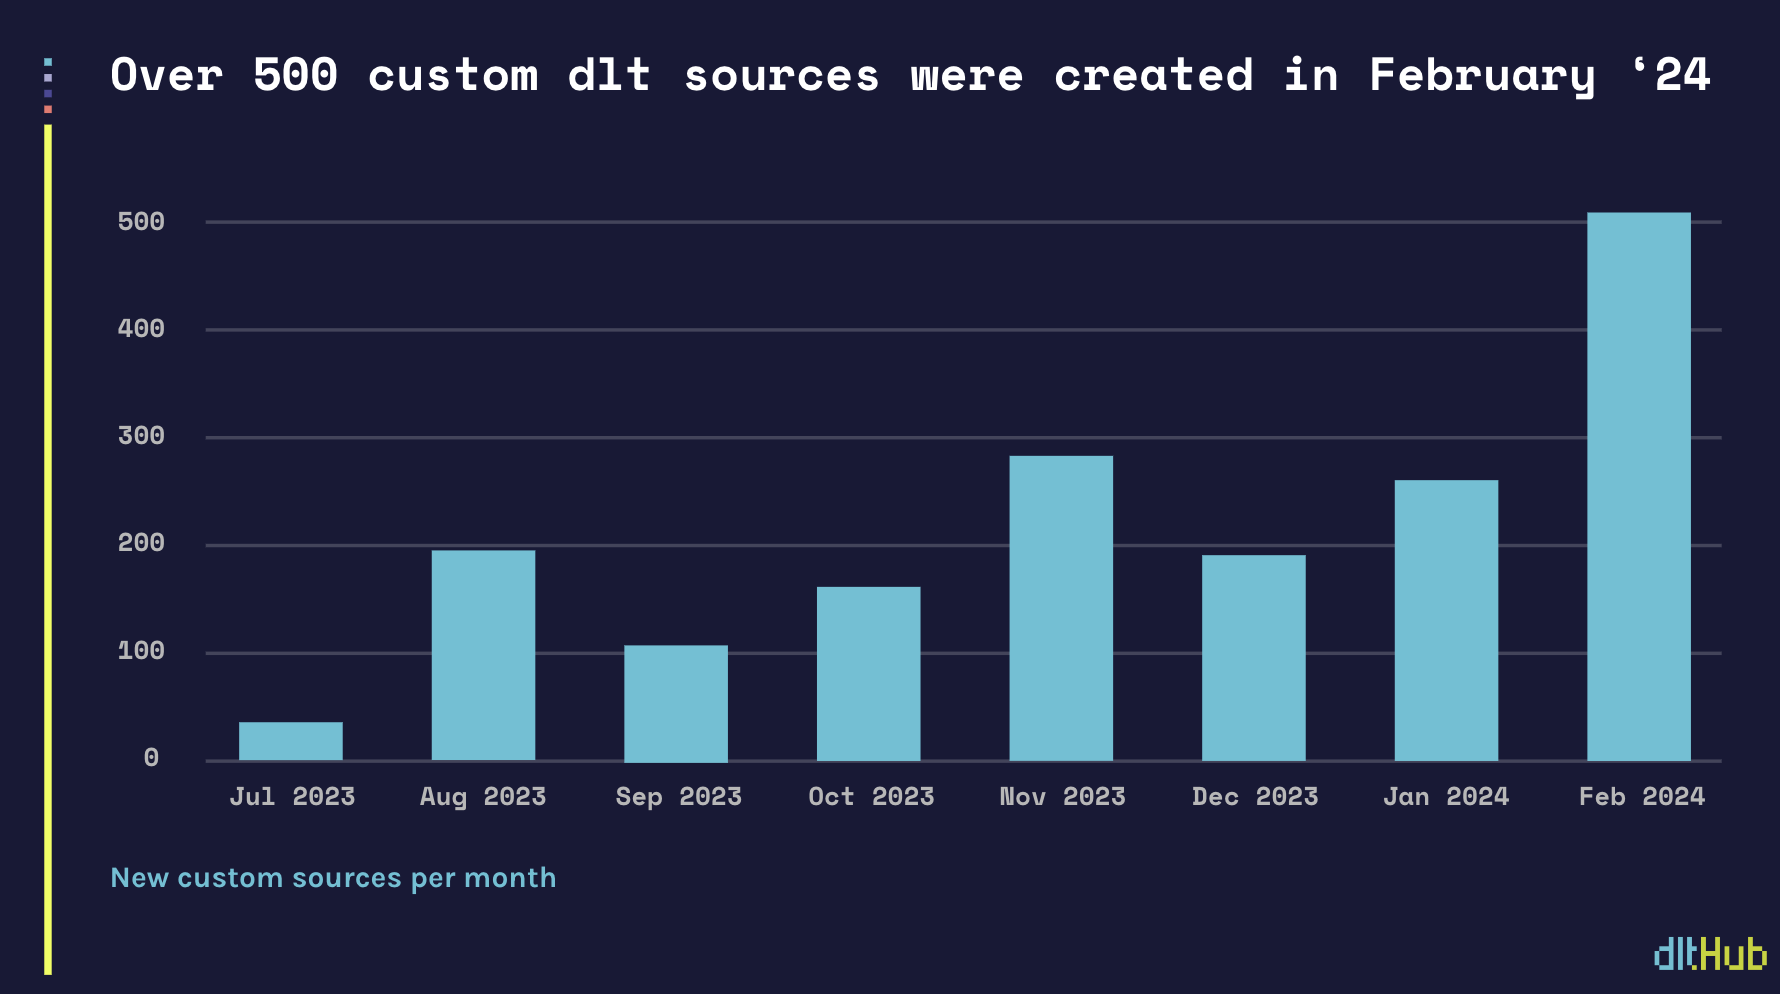
Celebrating over 500 ad hoc custom sources written by the dlt community in February

Today it is easier to pip install dlt and write a custom source than to setup and configure a traditional ETL platform.

The wider community is increasingly noticing these benefits. In February the community wrote over 500 dlt custom sources. Last week we crossed 2000 dlt total custom sources created since we launched dlt last summer.

custom sources

A custom dlt source is something new for our industry. With dlt we automated the majority of the work data engineers tasks that are usually done in traditional ETL platforms. Hence, creating an ad hoc dlt pipeline and source is a dramatically simpler. Maintaining a custom dlt source in production is relatively easy as most of the common pipeline maintenance issues are handled.

Today dlt users pick dlt because it is the fastest way to create a dataset. As we frequently hear it from all of you “dlt is pip install and go”. This is in line with our mission to make this next generation of Python users autonomous when they create and use data in their organizations.

How to get to 50,000 sources: let’s remove the dependency on source catalogs and move forward to ad hoc code

We think that “Pip install ETLs” or “EL as code” tools such as dlt are ushering a new era of ad hoc code. ad hoc code allows for automation and customization of very specific tasks.

Most of the market today is educated by Saas ETLs on the value of “source”/”connector” catalogs. The core is a short-tail catalog market of +-20 sources (product database replication, some popular CRMs and ads APIs) with the highest profit margins and intense competition among vendors. The long-tail source catalog market, depending on the vendor, is usually up to 400 sources, with much smaller support.

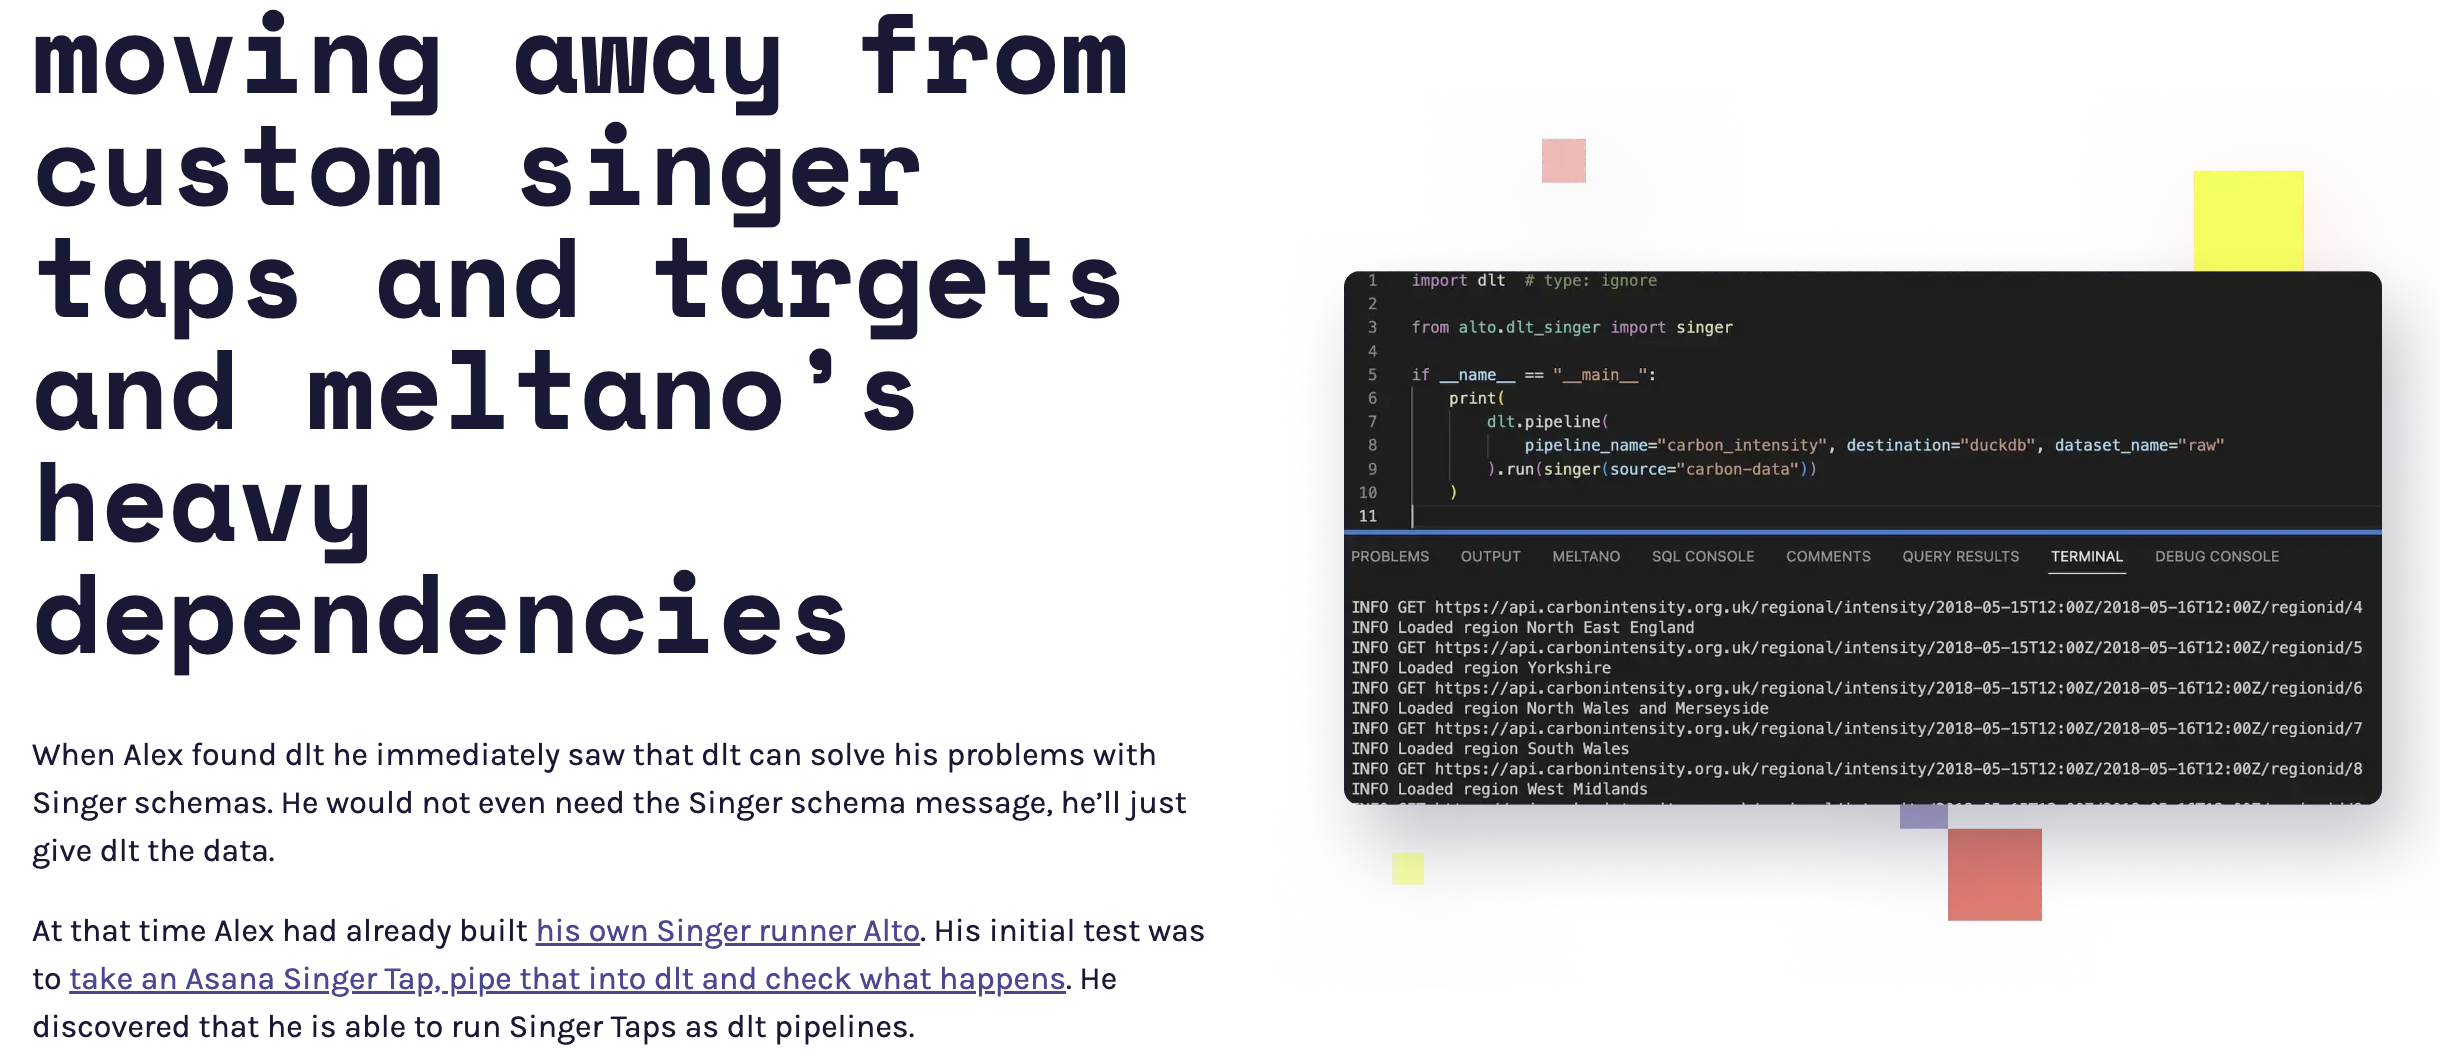
We think that source catalogs will become more and more irrelevant in the era of LLMs and ad hoc code. “EL as code” allows users to work with source catalog. From the beginning the dlt community has been writing wrappers for taps/connectors from other vendors, usually to migrate to a dlt pipeline at some point, as we documented in the customer story how Harness adopted dlt.

moving away from sources

Even for short-tail, high quality catalog sources “EL as code” allows for fixes of hidden gotchas and customisation that makes data pipelines production-ready.

We also believe that these are all early steps in “EL as code”. Huggingface hosts over 116k datasets as of March ‘24. We at dltHub think that the ‘real’ Pythonic ETL market is a market of 100k of APIs and millions of datasets.

dlt has been built for humans and LLMs from the get go and this will make coding data pipelines even faster

Since the inception of dlt, we have believed that the adoption dltamong the next generation of Python users will depend on its compatibility with code generation tools, including Codex, ChatGPT, and any new tools that emerge on the market..

We have not only been building dlt for humans, but also LLMs.

Back in March ‘23 we released dlt init as the simplest way to add a pipeline/initialize a project in dlt. We rebuilt the dlt library in such a way that it performs well with LLMs. At the end of May ‘23 we opened up our dltHub Slack to the broader community.

Back in June ‘23 we released a proof of concept of the 'dlt init' extension that can generate dlt pipelines from an OpenAPI specification. As we said at that time, if you build APIs, for example with FastAPI, you can, thanks to the OpenAPI spec, automatically generate a Python client and give it to your users. If you have 3min time watch how a demo Marcin generates such a pipeline from the OpenAPI spec using the Pokemon API in this Loom. This demo took things a step further and enables users to generate advanced dlt pipelines that, in essence, convert your API into a live dataset.

However, it takes a long time to go from a LLM PoC to production-grade code. We know much of our user base is already using ChatPGT and comparable tools to generate sources. We hear our community's excitement about the promise of LLMs for this task. The automation promise is in both in building and configuring pipelines. Anything seems possible, but if any of you have played around this task with ChatPGT - usually the results are janky. Along these lines in the last couple of months we have been dog fooding the PoC that can generate dlt pipelines from an OpenAPI specification.

comics

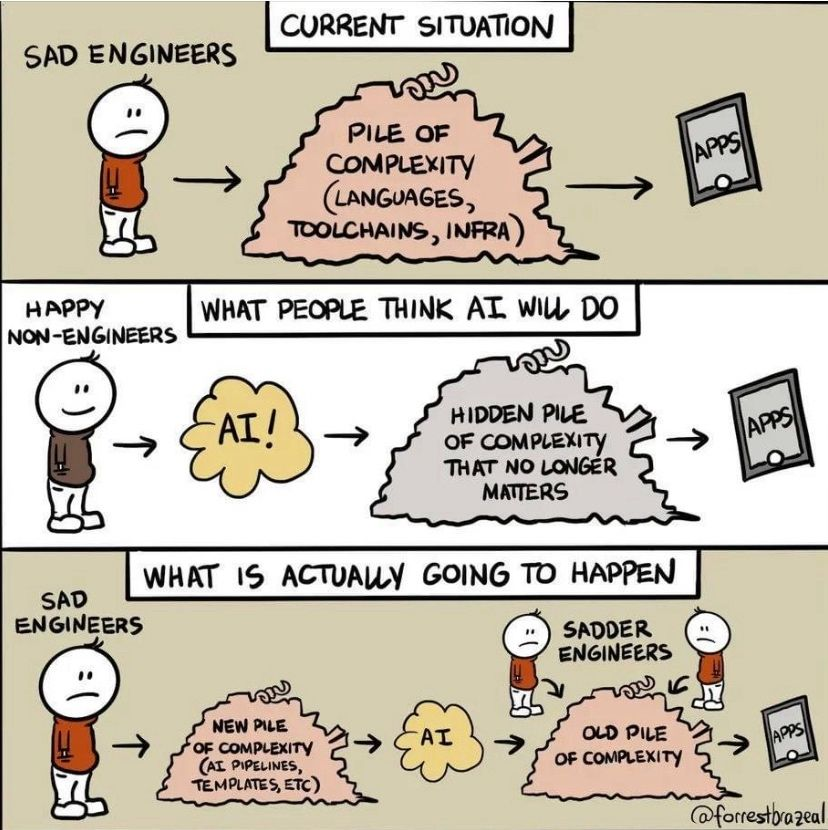
https://twitter.com/xatkit/status/1763973816798138370

You can read a case study on how our solution engineer Violetta used an iterated version of the PoC to generate a production-grade Chargebee dlt within hours instead of 2,3 days here.

We think that at this stage we are a few weeks away from releasing our next product that makes coding data pipelines faster than renting connector catalog: a dlt code generation tool that allows dlt users create datasets from the REST API in the coming weeks.

· 9 min read
Zaeem Athar
info

TL;DR: This blog post introduces a cost-effective solution for event streaming that results in up to 18x savings. The solution leverages Cloud Pub/Sub and dlt to build an efficient event streaming pipeline.

The Segment Problem

Event tracking is a complicated problem for which there exist many solutions. One such solution is Segment, which offers ample startup credits to organizations looking to set up event ingestion pipelines. Segment is used for a variety of purposes, including web analytics.

note

💡 With Segment, you pay 1-1.2 cents for every tracked users.

Let’s take a back-of-napkin example: for 100.000 users, ingesting their events data would cost $1000.

The bill:

  • Minimum 10,000 monthly tracked users (0-10K) + $120.
  • Additional 1,000 monthly tracked users (10K - 25K) + $12 / 1000 user.
  • Additional 1,000 monthly tracked users (25k - 100K) + $11 / 1000 user.
  • Additional 1,000 monthly tracked users (100k +) + $10 / 1000 user.

The price of $1000/month for 100k tracked users doesn’t seem excessive, given the complexity of the task at hand.

However, similar results can be achieved on GCP by combining different services. If those 100k users produce 1-2m events, those costs would stay in the $10-60 range.

In the following sections, we will look at which GCP services can be combined to create a cost-effective event ingestion pipeline that doesn’t break the bank.

goodbye segment

The Solution to the Segment Problem

Our proposed solution to replace Segment involves using dlt with Cloud Pub/Sub to create a simple, scalable event streaming pipeline. The pipeline's overall architecture is as follows:

pubsub_dlt-pipeline

In this architecture, a publisher initiates the process by pushing events to a Pub/Sub topic. Specifically, in the context of dlt, the library acts as the publisher, directing user telemetry data to a designated topic within Pub/Sub.

A subscriber is attached to the topic. Pub/Sub offers a push-based subscriber that proactively receives messages from the topic and writes them to Cloud Storage. The subscriber is configured to aggregate all messages received within a 10-minute window and then forward them to a designated storage bucket.

Once the data is written to the Cloud Storage this triggers a Cloud Function. The Cloud Function reads the data from the storage bucket and uses dlt to ingest the data into BigQuery.

Code Walkthrough

This section dives into a comprehensive code walkthrough that illustrates the step-by-step process of implementing our proposed event streaming pipeline.

Implementing the pipeline requires the setup of various resources, including storage buckets and serverless functions. To streamline the procurement of these resources, we'll leverage Terraform—an Infrastructure as Code (IaC) tool.

Prerequisites

Before we embark on setting up the pipeline, there are essential tools that need to be installed to ensure a smooth implementation process.

Permissions

Next, we focus on establishing the necessary permissions for our pipeline. A crucial step involves creating service account credentials, enabling Terraform to create and manage resources within Google Cloud seamlessly.

Please refer to the Google Cloud documentation here to set up a service account. Once created, it's important to assign the necessary permissions to the service account. The project README lists the necessary permissions. Finally, generate a key for the created service account and download the JSON file. Pass the credentials as environment variables in the project root directory.

export GOOGLE_APPLICATION_CREDENTIALS="/path/to/keyfile.json"

Setting Up The Event Streaming Pipeline

To set up our pipeline, start by cloning the GitHub Repository. The repository contains all the necessary components, structured as follows:

.
├── README.md
├── cloud_functions
│ ├── main.py
│ └── requirements.txt
├── publisher.py
├── requirement.txt
├── terraform
│ ├── backend.tf
│ ├── cloud_functions.tf
│ ├── main.tf
│ ├── provider.tf
│ ├── pubsub.tf
│ ├── storage_buckets.tf
│ └── variables.tf

Within this structure, the Terraform directory houses all the Terraform code required to set up the necessary resources on Google Cloud.

Meanwhile, the cloud_functions folder includes the code for the Cloud Function that will be deployed. This function will read the data from storage and use dlt to ingest data into BigQuery. The code for the function can be found in cloud_functions/main.py file.

Step 1: Configure Service Account Credentials

To begin, integrate the service account credentials with Terraform to enable authorization and resource management on Google Cloud. Edit the terraform/main.tf file to include the path to your service account's credentials file as follows:

provider "google" {
credentials = file("./../credentials.json")
project = var.project_id
region = var.region
}

Step 2: Define Required Variables

Next, in the terraform/variables.tf define the required variables. These variables correspond to details within your credentials.json file and include your project's ID, the region for resource deployment, and any other parameters required by your Terraform configuration:

variable "project_id" {
type = string
default = "Add Project ID"
}

variable "region" {
type = string
default = "Add Region"
}

variable "service_account_email" {
type = string
default = "Add Service Account Email"
}

Step 3: Procure Cloud Resources

We are now ready to set up some cloud resources. To get started, navigate into the terraform directory and terraform init. The command initializes the working directory containing Terraform configuration files.

With the initialization complete, you're ready to proceed with the creation of your cloud resources. To do this, run the following Terraform commands in sequence. These commands instruct Terraform to plan and apply the configurations defined in your .tf files, setting up the infrastructure on Google Cloud as specified.

terraform plan
terraform apply

This terraform plan command previews the actions Terraform intends to take based on your configuration files. It's a good practice to review this output to ensure the planned actions align with your expectations.

After reviewing the plan, execute the terraform apply command. This command prompts Terraform to create or update resources on Google Cloud according to your configurations.

The following resources are created on Google Cloud once terraform apply command is executed:

NameTypeDescription
tel_storageBucketBucket for storage of telemetry data.
pubsub_cfunctionsBucketBucket for storage of Cloud Function source code.
storage_bigqueryCloud FunctionThe Cloud Function that runs dlt to ingest data into BigQuery.
telemetry_data_teraPub/Sub TopicPub/Sub topic for telemetry data.
push_sub_storagePub/Sub SubscriberPub/Sub subscriber that pushes data to Cloud Storage.

Step 4: Run the Publisher

Now that our cloud infrastructure is in place, it's time to activate the event publisher. Look for the publisher.py file in the project root directory. You'll need to provide specific details to enable the publisher to send events to the correct Pub/Sub topic. Update the file with the following:

# TODO(developer)
project_id = "Add GCP Project ID"
topic_id = "telemetry_data_tera"

The publisher.py script is designed to generate dummy events, simulating real-world data, and then sends these events to the specified Pub/Sub topic. This process is crucial for testing the end-to-end functionality of our event streaming pipeline, ensuring that data flows from the source (the publisher) to our intended destinations (BigQuery, via the Cloud Function and dlt). To run the publisher execute the following command:

python publisher.py

Step 5: Results

Once the publisher sends events to the Pub/Sub Topic, the pipeline is activated. These are asynchronous calls, so there's a delay between message publication and their appearance in BigQuery.

The average completion time of the pipeline is approximately 12 minutes, accounting for the 10-minute time interval after which the subscriber pushes data to storage plus the Cloud Function execution time. The push interval of the subscriber can be adjusted by changing the max_duration in pubsub.tf

cloud_storage_config {
bucket = google_storage_bucket.tel_bucket_storage.name

filename_prefix = "telemetry-"

max_duration = "600s"

}

Our Cost Estimation

On average the cost for our proposed pipeline are as follows:

  • 100k users tracked on Segment would cost $1000.
  • 1 million events ingested via our setup $37.
  • Our web tracking user:event ratio is 1:15, so the Segment cost equivalent would be $55.
  • Our telemetry device:event ratio is 1:60, so the Segment cost equivalent would be $220.

So with our setup, as long as we keep events-to-user ratio under 270, we will have cost savings over Segment. In reality, it gets even better because GCP offers a very generous free tier that resets every month, where Segment costs more at low volumes.

GCP Cost Calculation: Currently, our telemetry tracks 50,000 anonymized devices each month on a 1:60 device-to-event ratio. Based on these data volumes we can estimate the cost of our proposed pipeline.

Cloud Functions is by far the most expensive service used by our pipeline. It is billed based on the vCPU / memory, compute time, and number of invocations.

note

💡 The cost of compute for 512MB / .333vCPU machine time for 1000ms is as follows

MetricUnit Price
GB-seconds (Memory)$0.000925
GHz-seconds (vCPU)$0.001295
Invocation$0.0000004
Total0.0022

This puts the monthly cost of ingesting 1 million events with Cloud Functions at:

  • (1 million / 60) * 0.0022 cents = $37

In Conclusion

Event streaming pipelines don’t need to be expensive. In this demo, we present an alternative to Segment that offers up to 18x in savings in practice. Our proposed solution leverages Cloud Pub/Sub and dlt to deliver a cost-effective streaming pipeline.

Following this demo requires knowledge of the publisher-subscriber model, dlt, and GCP. It took about 4 hours to set up the pipeline from scratch, but we went through the trouble and set up Terraform to procure infrastructure.

Use terraform apply to set up the needed infrastructure for running the pipeline. This can be done in 30 minutes, allowing you to evaluate the proposed solution's efficacy without spending extra time on setup. Please do share your feedback.

P.S: We will soon be migrating from Segment. Stay tuned for future posts where we document the migration process and provide a detailed analysis of the associated human and financial costs.

· 7 min read
Adrian Brudaru & Violetta Mishechkina

At dltHub, we have been pioneering the future of data pipeline generation, making complex processes simple and scalable. We have not only been building dlt for humans, but also LLMs.

Pipeline generation on a simple level is already possible directly in ChatGPT chats - just ask for it. But doing it at scale, correctly, and producing comprehensive, good quality pipelines is a much more complex endeavour.

Our early exploration with code generation

As LLMs became available at the end of 2023, we were already uniquely positioned to be part of the wave. By being a library, a LLM could use dlt to build pipelines without the complexities of traditional ETL tools.

This raised from the start the question - what are the different levels of pipeline quality? For example, how does a user code snippet, which formerly had value, compare to LLM snippets which can be generated en-masse? What does a perfect pipeline look like now, and what can LLMs do?

We were only able to answer some of these questions, but we had some concrete outcomes that we carry into the future.

In June ‘23 we added a GPT-4 docs helper that generates snippets

  • try it on our docs; it's widely used as code troubleshooter gpt-4 dhelp

We created an OpenAPI based pipeline generator

marcin-demo

Running into early limits of LLM automation: A manual last mile is needed

Ideally, we would love to point a tool at an API or doc of the API, and just have the pipeline generated.

However, the OpenApi spec does not contain complete information for generating a complete pipeline. There’s many challenges to overcome and gaps that need to be handled manually.

While LLM automation can handle the bulk, some customisation remains manual, generating requirements towards our ongoing efforts of full automation.

Why revisit code generation at dlt now?

Growth drives a need for faster onboarding

The dlt community has been growing steadily in recent months. In February alone we had a 25% growth on Slack and even more in usage.

New users generate a lot of questions and some of them used our onboarding program, where we speed-run users through any obstacles, learning how to make things smoother on the dlt product side along the way.

Onboarding usually means building a pipeline POC fast

During onboarding, most companies want to understand if dlt fits their use cases. For these purposes, building a POC pipeline is pretty typical.

This is where code generation can prove invaluable - and reducing a build time from 2-3d to 0.5 would lower the workload for both users and our team. 💡 To join our onboarding program, fill this form to request a call.

Case Study: How our solution engineer Violetta used our PoC to generate a production-grade Chargebee pipeline within hours

In a recent case, one of our users wanted to try dlt with a source we did not list in our public sources - Chargebee.

Since the Chargebee API uses the OpenAPI standard, we used the OpenAPI PoC dlt pipeline code generator that we built last year.

Starting resources

POC for getting started, human for the last mile.

Onward, let’s look at how our new colleague Violetta, ML Engineer, used this PoC to generate PoCs for our users.

Violetta shares her experience:

So the first thing I found extremely attractive — the code generator actually created a very simple and clean structure to begin with.

I was able to understand what was happening in each part of the code. What unfortunately differs from one API to another — is the authentication method and pagination. This needed some tuning. Also, there were other minor inconveniences which I needed to handle.

There were no great challenges. The most difficult tedious probably was to manually change pagination in different sources and rename each table.

1) Authentication The provided Authentication was a bit off. The generated code assumed the using of a username and password but what was actually required was — an empty username + api_key as a password. So super easy fix was changing

def to_http_params(self) -> CredentialsHttpParams:
cred = f"{self.api_key}:{self.password}" if self.password else f"{self.username}"
encoded = b64encode(f"{cred}".encode()).decode()
return dict(cookies={}, headers={"Authorization": "Basic " + encoded}, params={})

to

def to_http_params(self) -> CredentialsHttpParams:
encoded = b64encode(f"{self.api_key}".encode()).decode()
return dict(cookies={}, headers={"Authorization": "Basic " + encoded}, params={})

Also I was pleasantly surprised that generator had several different authentication methods built in and I could easily replace BasicAuth with BearerAuth of OAuth2 for example.

2) Pagination

For the code generator it’s hard to guess a pagination method by OpenAPI specification, so the generated code has no pagination 😞. So I had to replace a line

def f():
yield _build_response(requests.request(**kwargs))

with yielding form a 6-lines get_page function

def get_pages(kwargs: Dict[str, Any], data_json_path):
has_more = True
while has_more:
response = _build_response(requests.request(**kwargs))
yield extract_nested_data(response.parsed, data_json_path)
kwargs["params"]["offset"] = response.parsed.get("next_offset", None)
has_more = kwargs["params"]["offset"] is not None

The downside — I had to do it for each resource.

3) Too many files

The code wouldn’t run because it wasn’t able to find some models. I found a commented line in generator script

# self._build_models()

I regenerated code with uncommented line and understood why it was commented. Code created 224 .py files under the models directory. Turned out I needed only two of them. Those were models used in api code. So I just removed other 222 garbage files and forgot about them.

4) Namings

The only problem I was left with — namings. The generated table names were like ListEventsResponse200ListItem or ListInvoicesForACustomerResponse200ListItem . I had to go and change them to something more appropriate like events and invoices .

The result

Result: https://github.com/dlt-hub/chargebee-source

I did a walk-through with our user. Some additional context started to appear. For example, which endpoints needed to be used with replace write disposition, which would require specifying the merge keys. So in the end this source would still require some testing to be performed and some fine-tuning from the user. I think the silver lining here is how to start. I don’t know how much time I would’ve spent on this source if I started from scratch. Probably, for the first couple of hours, I would be trying to decide where should the authentication code go, or going through the docs searching for information on how to use dlt configs. I would certainly need to go through all API endpoints in the documentation to be able to find the one I needed. There are a lot of different things which could be difficult especially if you’re doing it for the first time. I think in the end if I had done it from scratch, I would’ve got cleaner code but spent a couple of days. With the generator, even with finetuning, I spent about half a day. And the structure was already there, so it was overall easier to work with and I didn’t have to consider everything upfront.

We are currently working on making full generation a reality.

· 2 min read
Adrian Brudaru

Intro

Here at dltHub, we work on the python library for data ingestion. So when I heard from Airbyte that they are building a library, I was intrigued and decided to investigate.

What is PyAirbyte?

PyAirbyte is an interesting Airbyte’s initiative - similar to the one that Meltano had undertook 3 years ago. It provides a convenient way to download and install Airbyte sources and run them locally storing the data in a cache dataset. Users are allowed to then read the data from this cache.

A Python wrapper on the Airbyte source is quite nice and has a feeling close to Alto. The whole process of cloning/pip installing the repository, spawning a separate process to run Airbyte connector and read the data via UNIX pipe is hidden behind Pythonic interface.

Note that this library is not an Airbyte replacement - the loaders of Airbyte and the library are very different. The library loader uses pandas.to_sql and sql alchemy and is not a replacement for Airbyte destinations that are available in Open Source Airbyte

Questions I had, answered

  • Can I run Airbyte sources with PyAirbyte? A subset of them.
  • Can I use PyAirbyte to run a demo pipeline in a colab notebook? Yes.
  • Would my colab demo have a compatible schema with Airbyte? No.
  • Is PyAirbyte a replacement for Airbyte? No.
  • Can I use PyAirbyte to develop or test during development Airbyte sources? No.
  • Can I develop pipelines with PyAirbyte? no

In conclusion

In wrapping up, it's clear that PyAirbyte is a neat little addition to the toolkit for those of us who enjoy tinkering with data in more casual or exploratory settings. I think this is an interesting initiative from Airbyte that will enable new usage patterns.

Want to discuss?

Join our slack community to take part in the conversation.

· 4 min read
Adrian Brudaru

In large organisations, there are often many data teams that serve different departments. These data teams usually cannot agree where to run their infrastructure, and everyone ends up doing something else. For example:

  • 40 generated GCP projects with various services used on each
  • Native AWS services under no particular orchestrator
  • That on-prem machine that’s the only gateway to some strange corporate data
  • and of course that SaaS orchestrator from the marketing team
  • together with the event tracking lambdas from product
  • don’t forget the notebooks someone scheduled

So, what’s going on? Where is the data flowing? what data is it?

The case at hand

At dltHub, we are data people, and use data in our daily work.

One of our sources is our community slack, which we use in 2 ways:

  1. We are on free tier Slack, where messages expire quickly. We refer to them in our github issues and plan to use the technical answers for training our GPT helper. For these purposes, we archive the conversations daily. We run this pipeline on github actions (docs) which is a serverless runner that does not have a short time limit like cloud functions.
  2. We measure the growth rate of the dlt community - for this, it helps to understand when people join Slack. Because we are on free tier, we cannot request this information from the API, but can capture the event via a webhook. This runs serverless on cloud functions, set up as in this documentation.

So already we have 2 different serverless run environments, each with their own “run reporting”.

Not fun to manage. So how do we achieve a single pane of glass?

Alerts are better than monitoring

Since “checking” things can be tedious, we rather forget about it and be notified. For this, we can use slack to send messages. Docs here.

Here’s a gist of how to use it

from dlt.common.runtime.slack import send_slack_message

def run_pipeline_and_notify(pipeline, data):
try:
load_info = pipeline.run(data)
except Exception as e:
send_slack_message(
pipeline.runtime_config.slack_incoming_hook,
f"Pipeline {pipeline.pipeline_name} failed! \n Error: {str(e)}")
raise

Monitoring load metrics is cheaper than scanning entire data sets

As for monitoring, we could always run some queries to count the amount of loaded rows ad hoc - but this would scan a lot of data and cost significantly on larger volumes.

A better way would be to leverage runtime metrics collected by the pipeline such as row counts. You can find docs on how to do that here.

If we care, governance is doable too

Now, not everything needs to be governed. But for the slack pipelines we want to tag which columns have personally identifiable information, so we can delete that information and stay compliant.

One simple way to stay compliant is to annotate your raw data schema and use views for the transformed data, so if you delete the data at source, it’s gone everywhere.

If you are materialising your transformed tables, you would need to have column level lineage in the transform layer to facilitate the documentation and deletion of the data. Here’s a write up of how to capture that info. There are also other ways to grab a schema and annotate it, read more here.

In conclusion

There are many reasons why you’d end up running pipelines in different places, from organisational disagreements, to skillset differences, or simply technical restrictions.

Having a single pane of glass is not just beneficial but essential for operational coherence.

While solutions exist for different parts of this problem, the data collection still needs to be standardised and supported across different locations.

By using a tool like dlt, standardisation is introduced with ingestion, enabling cross-orchestrator observability and monitoring.

Want to discuss?

Join our slack community to take part in the conversation.

This demo works on codespaces. Codespaces is a development environment available for free to anyone with a Github account. You'll be asked to fork the demo repository and from there the README guides you with further steps.
The demo uses the Continue VSCode extension.

Off to codespaces!

DHelp

Ask a question

Welcome to "Codex Central", your next-gen help center, driven by OpenAI's GPT-4 model. It's more than just a forum or a FAQ hub – it's a dynamic knowledge base where coders can find AI-assisted solutions to their pressing problems. With GPT-4's powerful comprehension and predictive abilities, Codex Central provides instantaneous issue resolution, insightful debugging, and personalized guidance. Get your code running smoothly with the unparalleled support at Codex Central - coding help reimagined with AI prowess.